

Executive Summary
After months of consolidation, Sembcorp Industries is charging ahead, fueled by strong bullish momentum and a breakout above key resistance levels. The 100-day moving average remains firmly above the 200-day moving average, signaling a sustained uptrend, while my 1GT (Pro) Indicator flashed a bullish signal at $5.50—right before the stock took off. Now sitting above the critical $6.00 support, all eyes are on the next big test at $7.00, where profit-taking could emerge. Will the rally power through to fresh highs, or is a pullback on the horizon? Traders are watching closely—dive into my latest analysis to uncover the key levels, potential entry points, and how to position yourself for the next big move. We will also cover how you can use a tool to potentially increase your ROI.
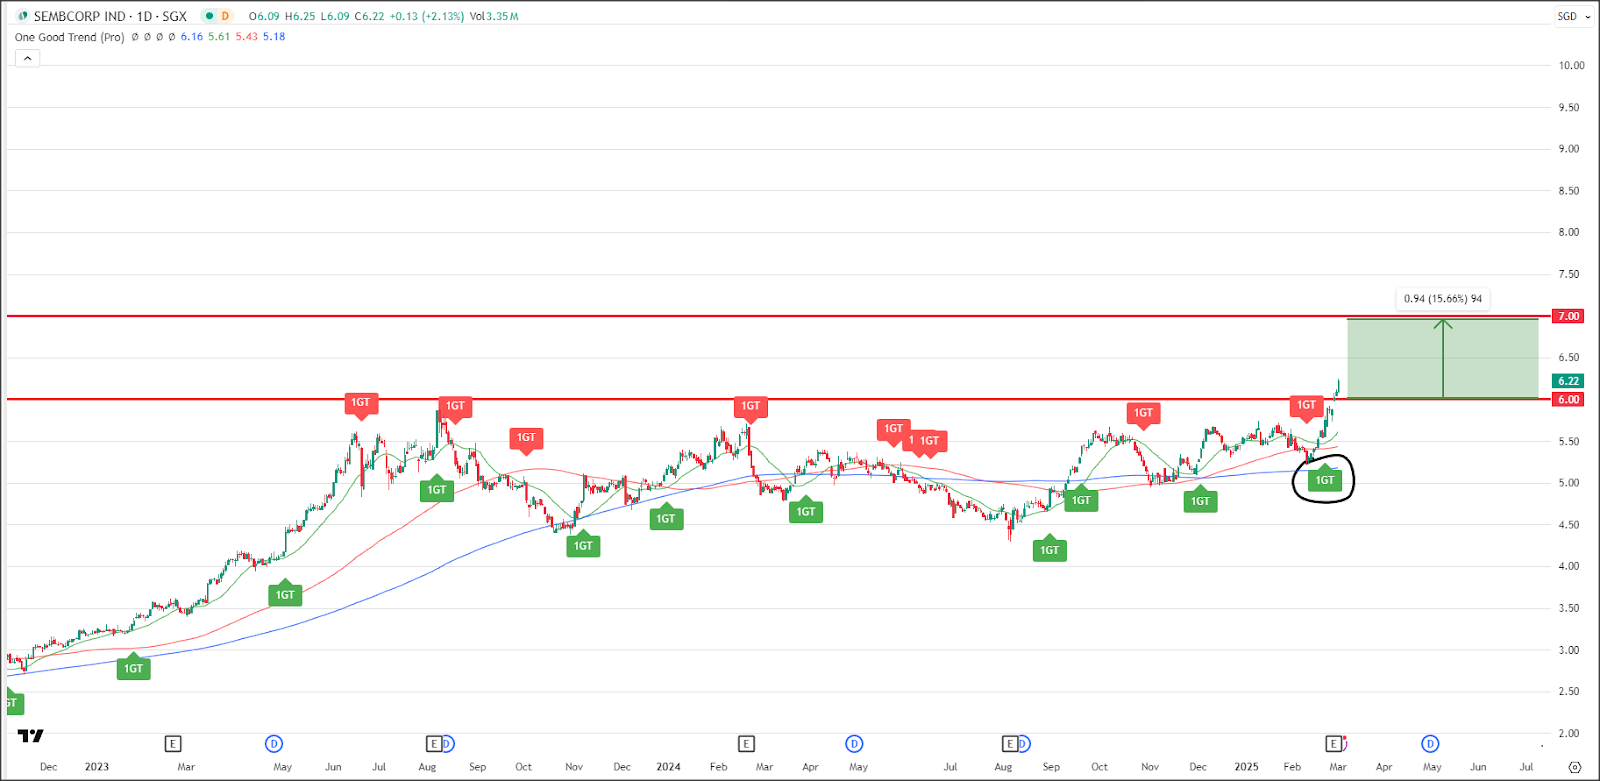
TradingView Chart – 3 Mar 2025
Sembcorp Industries Ltd., a leading energy and urban solutions provider, plays a critical role in sustainable energy transitions.
The company is focused on renewable energy, water, and urban development, making it a key player in Singapore’s shift towards a low-carbon future.
The stock has recently displayed strong bullish momentum after an extended consolidation phase since early 2023.
Looking at the long-term trend, the 100-day moving average (red line) has remained above the 200-day moving average (blue line) and both pointed up in the past 2 months, reinforcing the broader uptrend.
In the short term, the 20-day moving average (green line) has also turned up sharply in the last 2 weeks, confirming strong buying interest and short-term bullish momentum.
The 1GT (Pro) Indicator has provided timely signals, with a bullish signal appearing near $5.50, marking a key turning point before the recent rally.
This signal aligned with a rebound of a crucial support zone at 5.00, indicating growing momentum and renewed interest in the stock.
So far, no bearish signals have emerged, suggesting that the uptrend remains intact.
Support is now firmly established at $6.00, which was previously a major resistance level that has been breached.
This level now serves as an important area for buyers to defend.
Conservative traders may look for pullbacks toward this level to accumulate, with a stop-loss placed slightly below to manage risk.
Aggressive trader can consider timing entry around current levels for more upside if stock does not retrace.
On the upside, target is seen at $7.00, representing the next key hurdle for the stock where some profit taking can occur.
Given the current strong trend and the rising moving averages, a successful breakout would signal a continuation of the uptrend, potentially leading to new highs.
With both the long-term and short-term trends aligning bullishly and strong confirmation from my 1GT (Pro) Indicator, Sembcorp Industries remains in a favorable position for further upside.
Traders should continue to monitor price action around key support and resistance levels while implementing disciplined risk management to maximize gains in this trending stock.

So, how does one take a position in Sembcorp Ind whereby you are able to reap more potential return to ride the uptrend further?
Those keen to ride on the short-term upward momentum in Sembcorp Ind shares can consider using warrants to leverage on that move.
The reason for that is that the warrants can potentially generate magnified returns for a given move in the underlying.
To capitalize on a share price move from its current price level to the $7 target price, investors can consider using a call warrant tracking Sembcorp Industries (SCI) to generate higher potential returns if the share price moves in the right direction of the trade.
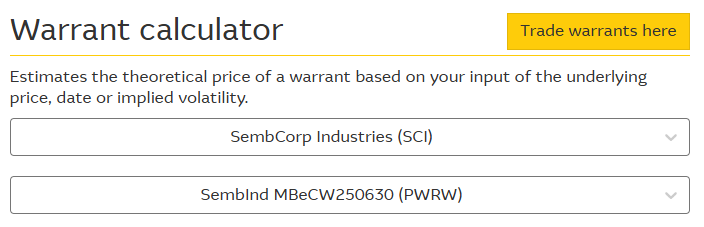
To estimate the performance and maximum holding period of Macquarie’s trending SCI call warrant PWRW (strike: $6.00, expiry: 30 June 2025) should SCI move to $7 from here, one can use the Warrant Calculator.
Under “Underlying price target” on the right column, enter the target price of $7, and move the date slider to a later date.
For example, if SCI shares were to move 11.8% higher from today to $7 in a month’s time, the warrant would approximately increase five times more than SCI shares: 60.4% from $0.048 when SCI shares are trading at $6.26 on 3 March to $0.077 if SCI shares were to trade at $7 on 5 April.
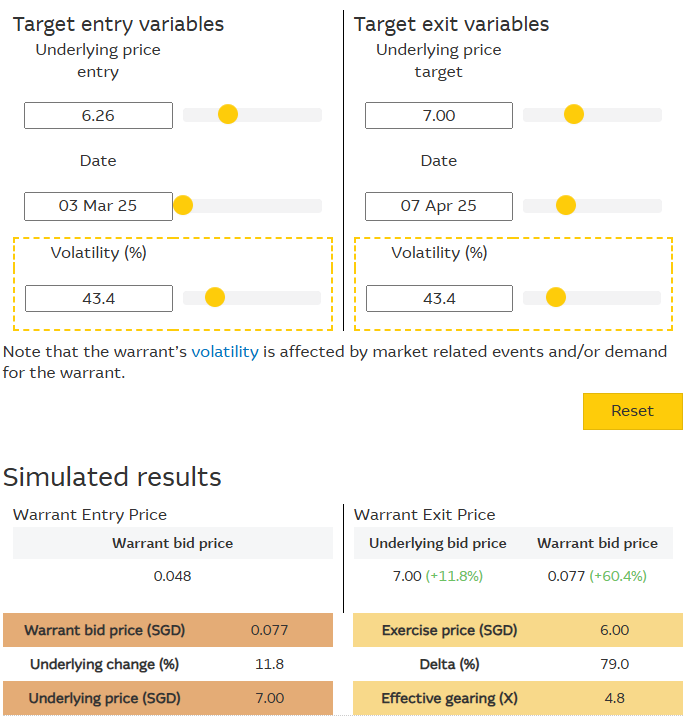
Source: Warrant Calculator for PWRW as of 3 March 2025, https://warrants.com.sg/tools/warrantcalculator/PWRW
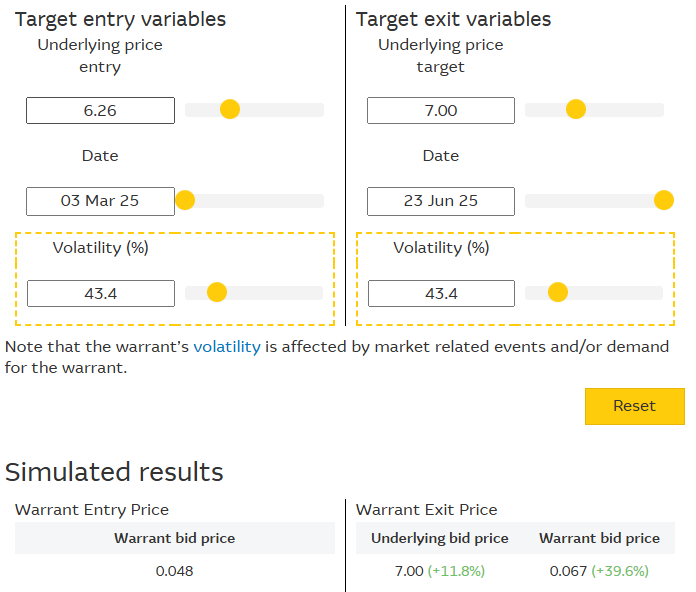
Increasing the date further to the warrant’s last trading date of 23 June (maximum date to select), and one would see that the warrant’s percentage gain will now drop to 39.6% to $0.067, as a result of time decay “eating” into the warrant’s gearing effect.
The warrant will now outweigh SCI’s share price gain by only 3.3 times.
However, if the share were to fall back to just below $6, to one’s cut loss level of say $5.80, the warrant will also produce a magnified drop with a close to 92% drop in the warrant price vs a 7.3% decrease in the underlying share price
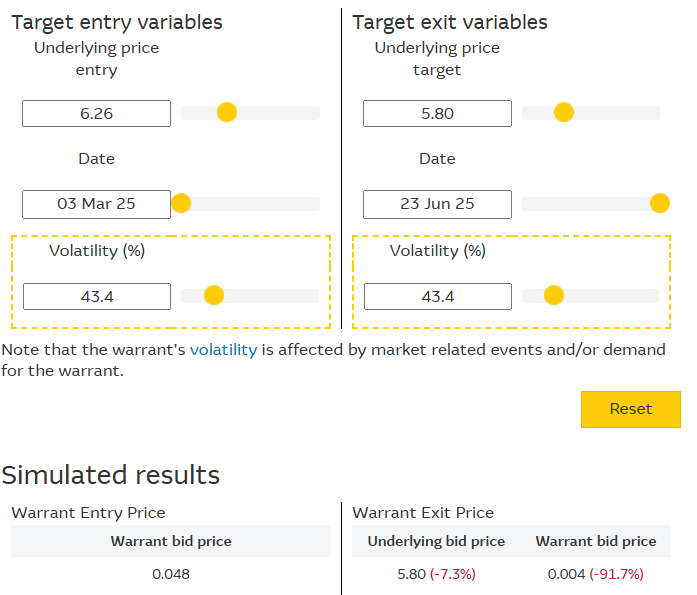
Note that if a warrant investor doesn’t cut the warrant position with the approximate 91.7% loss and holds the warrant beyond its last trading date of 23 June 2025, he/she will end up with 100% loss on the warrant investment if SCI fails to close at an average price (in the last five days prior to its 30 June expiry) above the warrant’s strike price of $6.00.
To conclude, it is therefore important that a warrant investor uses the Warrant Calculator to be aware of one’s maximum holding period, the simulated returns of the warrant based on the stock underlying’s entry, exit and cut loss prices, before entering into a warrant.
The sharing on how one can take a position using warrants has been contributed by Macquarie warrants Singapore who is the issuer of these warrants listed on SGX.
About the Author - Joey Choy
Joey is Singapore’s renowned mentor on how to make an income by trading the stock market, an author and one of the most-watched, quoted and followed stock trading trainers in Singapore. Over the years, he has conducted numerous full house seminars, enriching thousands to trade more profitably.
Joey’s come back story from a S$740k debt has been featured in the Business Times and inspired thousands in Singapore. In less than 3 years, he is highly regarded as one of the Top Tier Remisiers (Stock Brokers) and Traders, bagging numerous yearly awards like Top Trading Representative and Top CFD Achiever every year from 2014 to 2023 in Phillip Securities.
More about Joey here
Hope you have found the above content useful 😃
If you are keen to find out more on how to be a VIP Client of mine to receive daily market updates and exclusive actionable stock ideas, you can check it out here!
Look forward to see you on the inside!
- Joey
Disclaimer and Warning
This publication is provided by Trading Impossible Pte Ltd for general information and educational purposes only. Trading Impossible Pte Ltd is NOT licensed or regulated for the provision of investment or financial advice, and we do not seek to do so.
This content has been produced by Trading Impossible Pte Ltd. Singapore Exchange Limited (“SGX”) and/or its affiliates (collectively with SGX, the “SGX Group Companies”) have not had any input into this publication and/or the content, and SGX shall not be responsible or liable for the same. This document/material is not an offer or solicitation to buy or sell, nor financial advice or recommendation for any investment product. This document/material has been published for general circulation only. It does not address the specific investment objectives, financial situation or particular needs of any person. Advice should be sought from a financial adviser regarding the suitability of any investment product before investing or adopting any investment strategies. Use of and/or reliance on this document/material is entirely at the reader’s own risk. Trading Impossible Pte Ltd shall not be liable for any loss arising from any investment based on any perceived recommendation, forecast, or any other information contained here. Investment products are subject to significant investment risks, including the possible loss of the principal amount invested. Past performance of investment products is not indicative of their future performance. Any forecast, prediction or projection in this document/material is not necessarily indicative of the future or likely performance of the product. Examples (if any) provided are for illustrative purposes only. This document/material is not intended for distribution to, or for use by or to be acted on by any person or entity located in any jurisdiction where such distribution, use or action would be contrary to applicable laws or regulations or would subject the SGX Group Companies to any registration or licensing requirement. While each of the SGX Group Companies have taken reasonable care to ensure the accuracy and completeness of the information provided, each of the SGX Group Companies disclaims any and all guarantees, representations and warranties, expressed or implied, in relation to this document/material and shall not be responsible or liable (whether under contract, tort (including negligence) or otherwise) for any loss or damage of any kind (whether direct, indirect or consequential losses or other economic loss of any kind, including without limitation loss of profit, loss of reputation and loss of opportunity) suffered or incurred by any person due to any omission, error, inaccuracy, incompleteness, or otherwise, any reliance on such information, or arising from and/or in connection with this document/material. The information in this document/material may have been obtained via third party sources and which have not been independently verified by any SGX Group Company. No SGX Group Company endorses or shall be liable for the content of information provided by third parties (if any). The SGX Group Companies may deal in investment products in the usual course of their business, and may be on the opposite side of any trades. Each of SGX, Singapore Exchange Securities Trading Limited and Singapore Exchange Bond Trading Pte. Ltd. is an exempt financial adviser under the Financial Advisers Act (Cap. 110) of Singapore. The information in this document/material is subject to change without notice. This document/material shall not be reproduced, republished, uploaded, linked, posted, transmitted, adapted, copied, translated, modified, edited or otherwise displayed or distributed in any manner without SGX’s prior written consent. Please note that the general disclaimers and jurisdiction specific disclaimers found on SGX’s website at http://www.sgx.com/terms-use are also incorporated into and applicable to this document/material.