- Joey Choy Top Stocks
- Posts
- September 2025 Newsletter
September 2025 Newsletter
Market Updates and Top Stock Picks from Singapore & US market
Hello everyone,
As we step into September, opportunities are lining up across both U.S. and Singapore markets. Strong earnings from global tech leaders and resilient consumer demand continue to drive momentum, while local names are showing signs of renewed strength. For investors, this is a great time to reassess positions, spot fresh trends, and stay ahead of the curve. In this month’s edition, we break down the key movers and highlight where value and growth could align in the weeks ahead.
Your No.1 Fan,
Joey Choy

Market Overview
Singapore
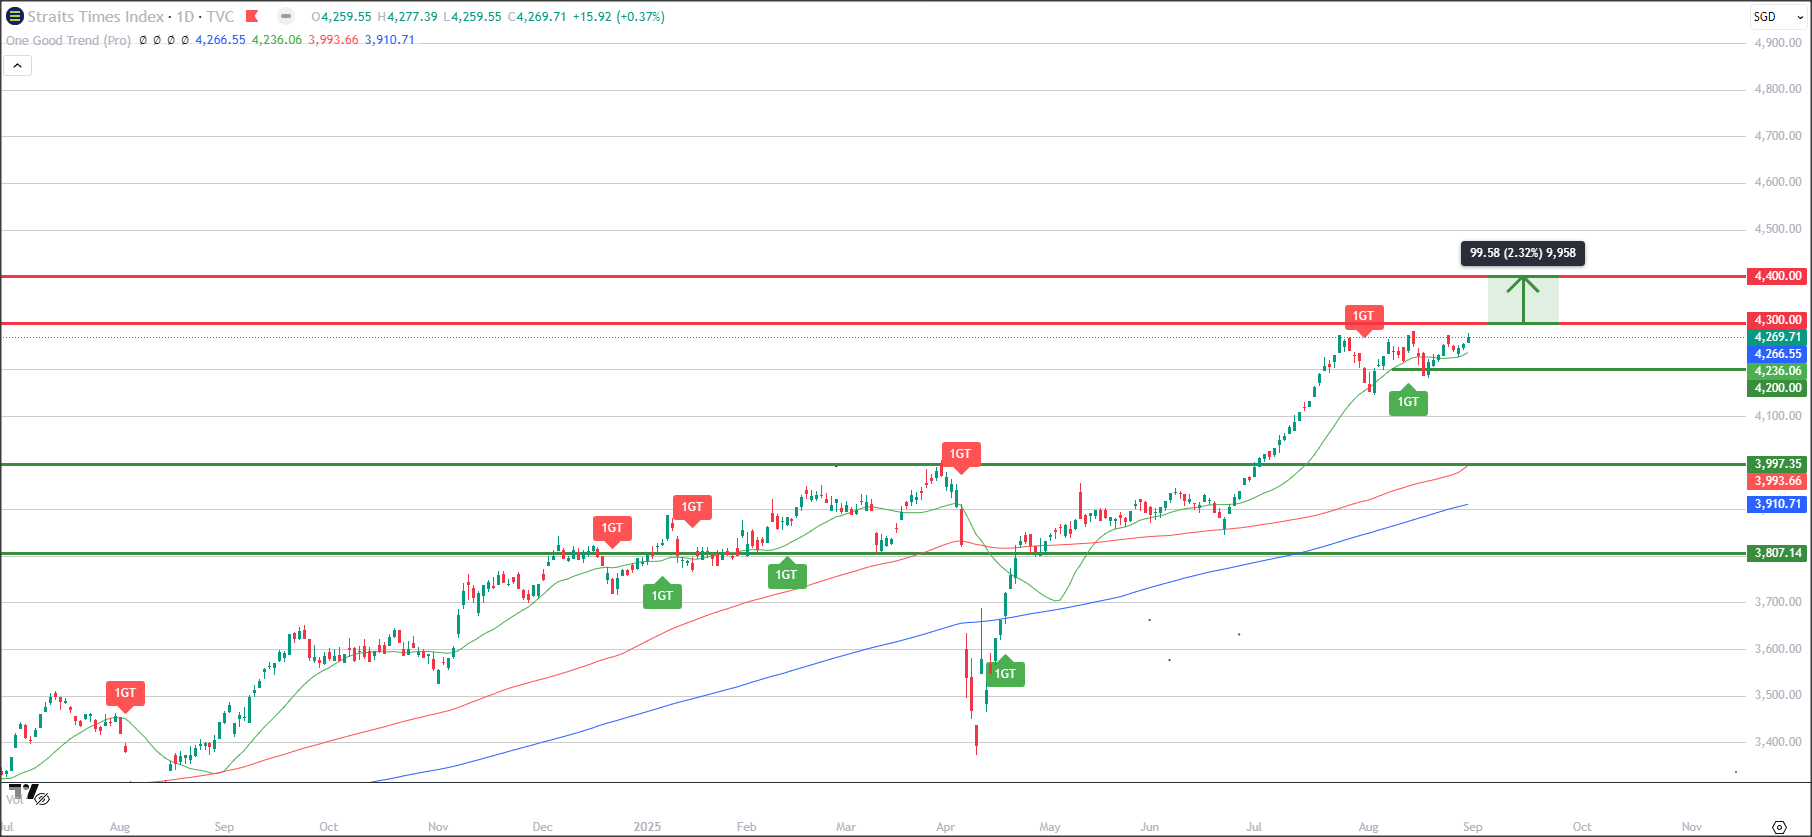
Straits Times Index (TradingView)
Straits Times Index (STI) is a market capitalisation weighted index that tracks the performance of the top 30 companies listed on SGX.
Singapore’s core inflation rose 0.5% year-on-year in July, below the 0.6% forecast. Headline inflation at 0.6%, also came in under the expected 0.7%. These figures suggest moderated inflationary pressure, potentially keeping monetary policy accommodative in the near term.
The Monetary Authority of Singapore (MAS) initiated a S$5 billion Equity Market Development Programme (EQDP). So far, S$1.1 billion has been deployed to leading fund managers to encourage local equity investing, particularly in small and mid-cap segments. Subsidies for new ETFs, secondary listings, and equity research bolster this effort.
The MAS injection has added fuel to the rally, particularly among smaller names. The STI rally through 4,200 was coincident with many Singaporean stocks hitting fresh 52-week highs. The push is encouraging investors to explore opportunities beyond blue-chip staples.
The 4,300 resistance level continues to hold firm as the index had pulled back from this level over the past 2 months, as the nearer term consolidation could continue if the index can stay above the 4,200 support level.
Longer term uptrend remains intact with the 100d and 200d moving averages still sloping upward, where a potential break above the 4,300 level could mean the next phase of this uptrend continuing toward the 4,400 level.
United States
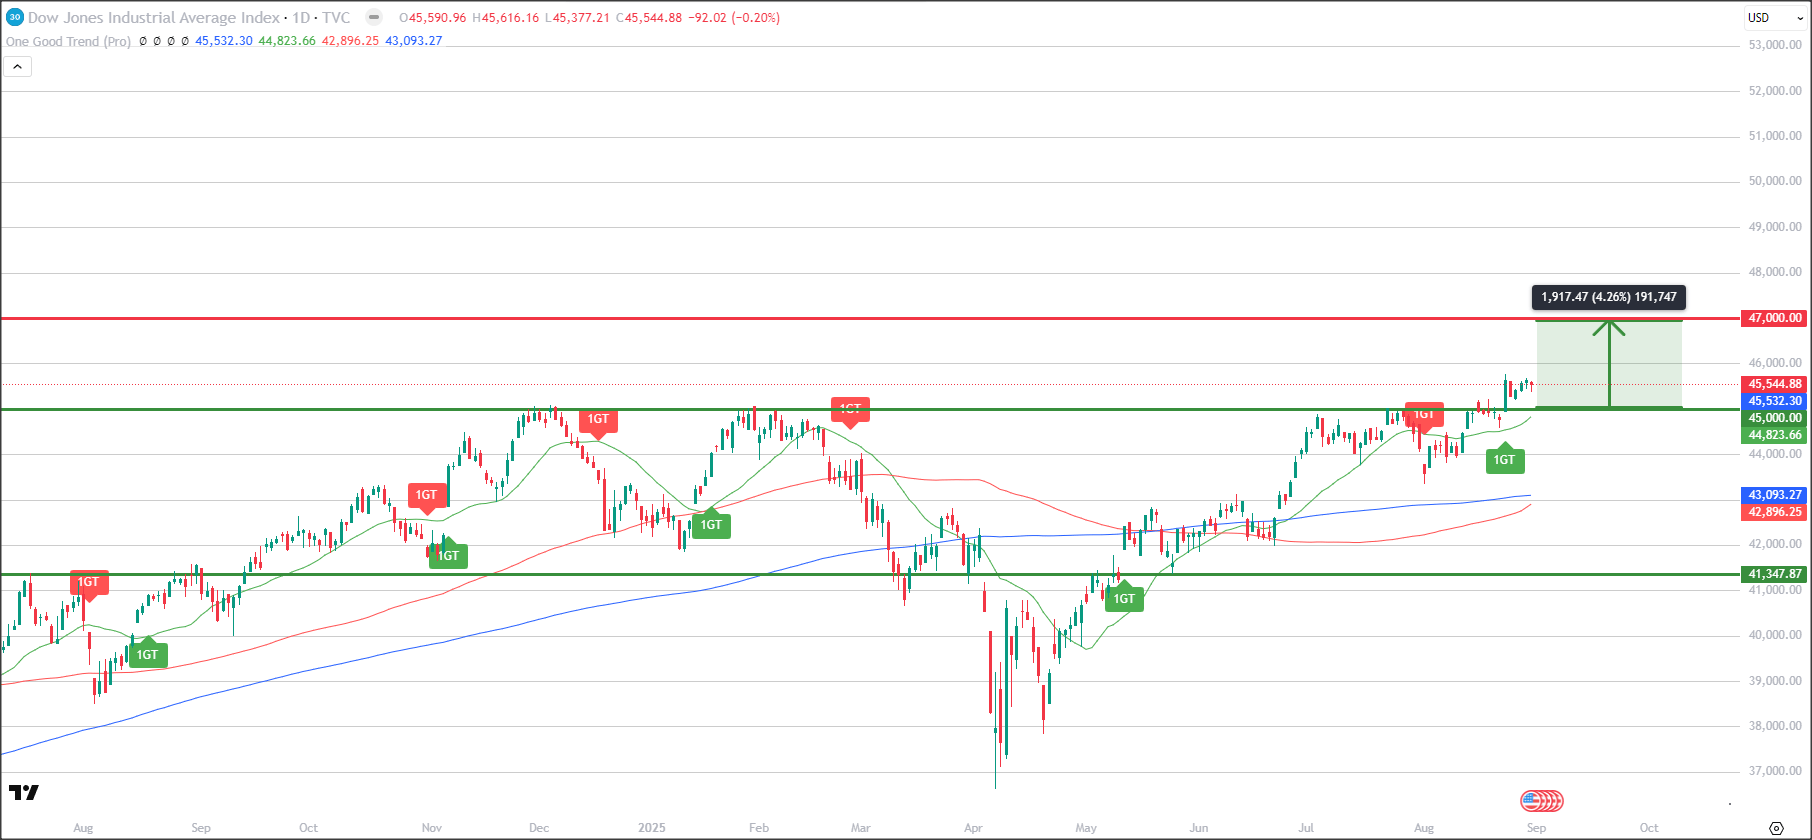
Dow Jones Industrial Average (TradingView)
Dow Jones Industrial Average (DJIA) tracks the daily price movements of 30 large, public-owned blue-chip American companies.
With the 45,000 level breached, a new support could be formed at this level as the index heads to new highs, although the 100d moving averages is still below the 200d moving average for now but both are starting to slope up.
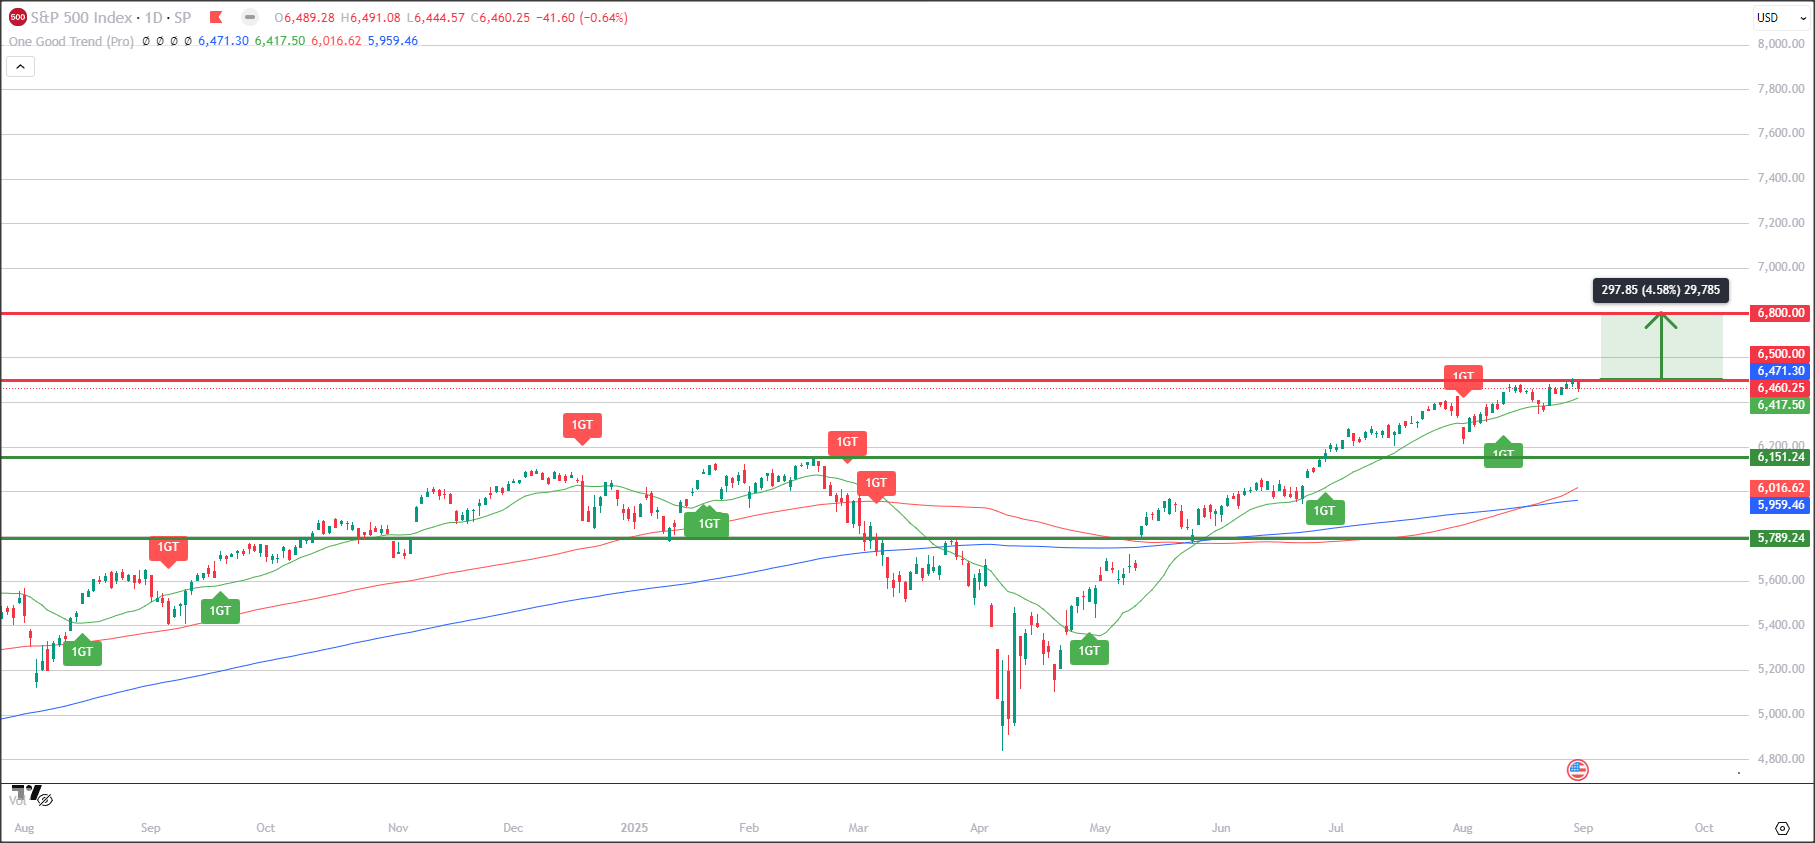
S&P 500 (TradingView)
S&P 500 Index is a market-capitalization weighted index of the 500 leading companies in the US which is widely considered as one of the best gauge of the US economy.
With the 6,500 resistance still being tested, it remains the key resistance, potentially forming a new support if this level is broken. The next potential upside target could be toward the 6,850 level in the longer term as the 100d moving average had just crossed above the 200d moving average.
Powell signaled that the Fed is “prepared to adjust policy as needed” to keep the economy on track, widely interpreted as opening the door to a rate cut later this year during the Jackson Hole Symposium.
Corporate earnings continued to surprise with tech and consumer names driving much of the momentum. Optimism around AI and digital adoption also kept sentiment buoyant.
Risks around inflation, tariffs, and valuation suggest the ride ahead may not be smooth, but for now, the trend remains constructive.
Hot News (Click to read):
Singapore Stocks Spotlight
SINGTEL (Z74.SI)
Target Price: S$4.50
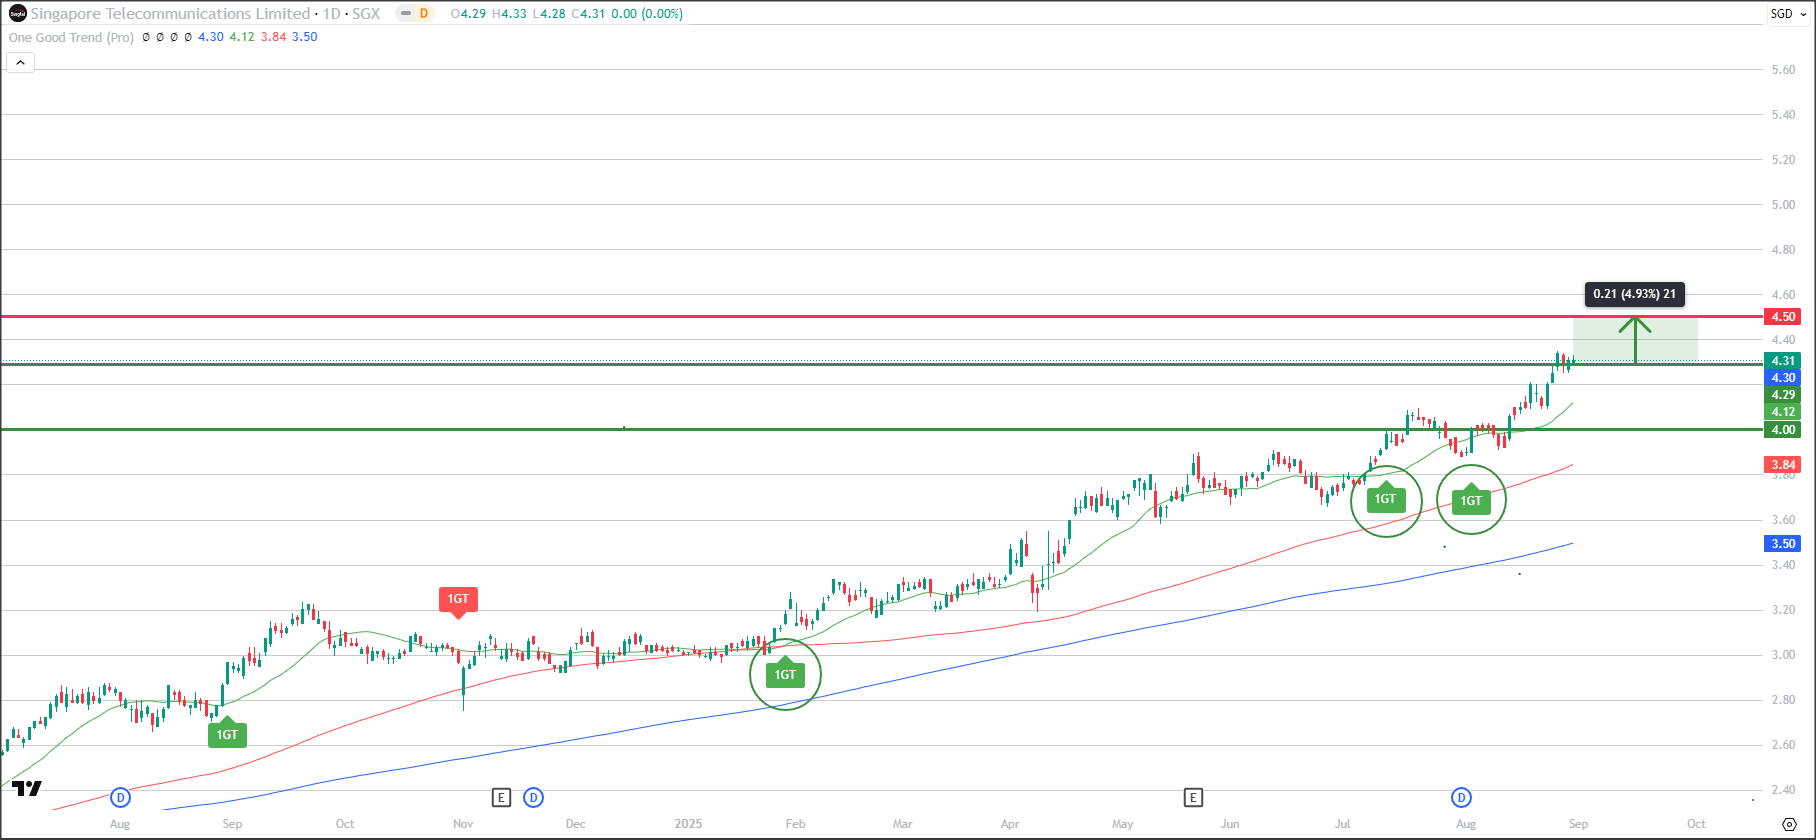
Singtel (TradingView)
1GT Bullish Entry Signal Appeared on the 04 Aug 25, No Exit Signals Yet
About Singtel
Singapore Telecommunications Limited (Singtel) is Asia’s leading communications technology group, with core operations across mobile, broadband, enterprise, and digital services
The group continues to evolve through investments in regional associates and next-generation infrastructure
Fundamental
For FY2025, Singtel reported net profit of S$1.23 billion, a 42% decline year-on-year due to the absence of a one-off gain from the prior year’s Telkomsel merger
Core EBIT rose 27%, driven by improved enterprise services and contributions from Nxera and NCS. Nxera is on track to launch new AI-ready data centres by mid-2025, boosting Singtel’s digital transformation roadmap
With a sharpened focus on infrastructure, AI, and regional partnerships, Singtel remains a key dividend and transformation play in the region
Technical
Both short-term and long term uptrend remains firmly intact with all 3 MAs still heading upwards
Price is currently testing the 4.30 level
If 4.30 is firmly breach, would not rule out more potential upside towards 4.50
3 consecutive 1GT Bullish signals are still playing out
Would be great to observe for sideway consolidation between 4.10 - 4.30 before breaking above range for a healthy and sustainable uptrend
YZJ FIN HOLDING (YF8.SI)
Target Price: S$1.20
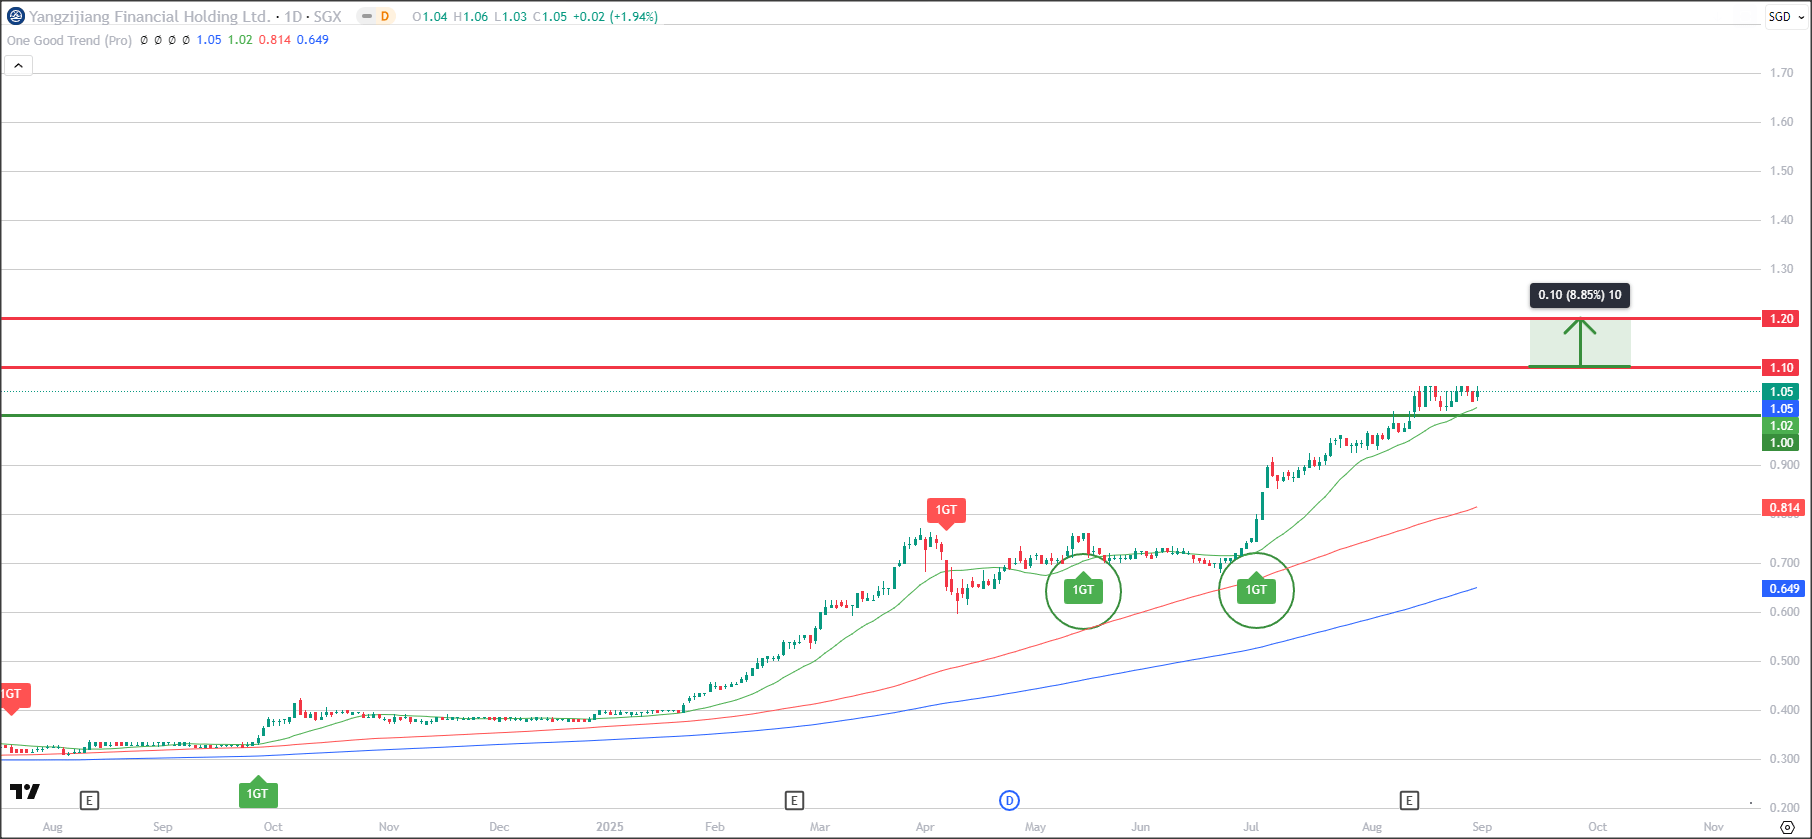
YZJ Fin Holding (TradingView)
1GT Bullish Entry Signal Appeared on 2 Jul 25, No Exit Signal Yet
About YZJ Fin Holding
YZJ Financial Holdings is the investment arm spun off from Yangzijiang Shipbuilding in 2022.
It focuses on fund management and debt investments rather than shipbuilding, giving investors exposure to the financial services space while still leveraging the group’s strong China roots.
Primarily invests in fixed income and private credit products, with a mandate to deliver stable returns.
Fundamental
YZJ Financial trades at a reasonable valuation with a P/E ratio of ~12x and a Price-to-NAV of 0.95, suggesting it’s still undervalued relative to book.
Dividend yield sits at ~3.3%, supported by solid profitability (ROE ~8.7%). While topline revenue fell ~7% year-on-year, net earnings surged over 120%, highlighting stronger efficiency and investment gains.
With no net debt, the company is well-positioned to expand its Assets Under Management (AUM) and capture opportunities in Asia’s growing private credit market.
Technical
Price has been consolidating sideways for the past 1-2 weeks holding above the psychological 1.00 support level
All 3 moving averages are still heading up, indicating uptrend is still intact
2 consecutive 1GT Bullish signals are still playing out since May
As long as price is able to hold firmly above 1.00, potential upside target towards 1.20
Would not be surprise if there are some selling pressure returning around 1.10 level first
HONG LEONG ASIA (H22.SI)
Target Price: S$2.80
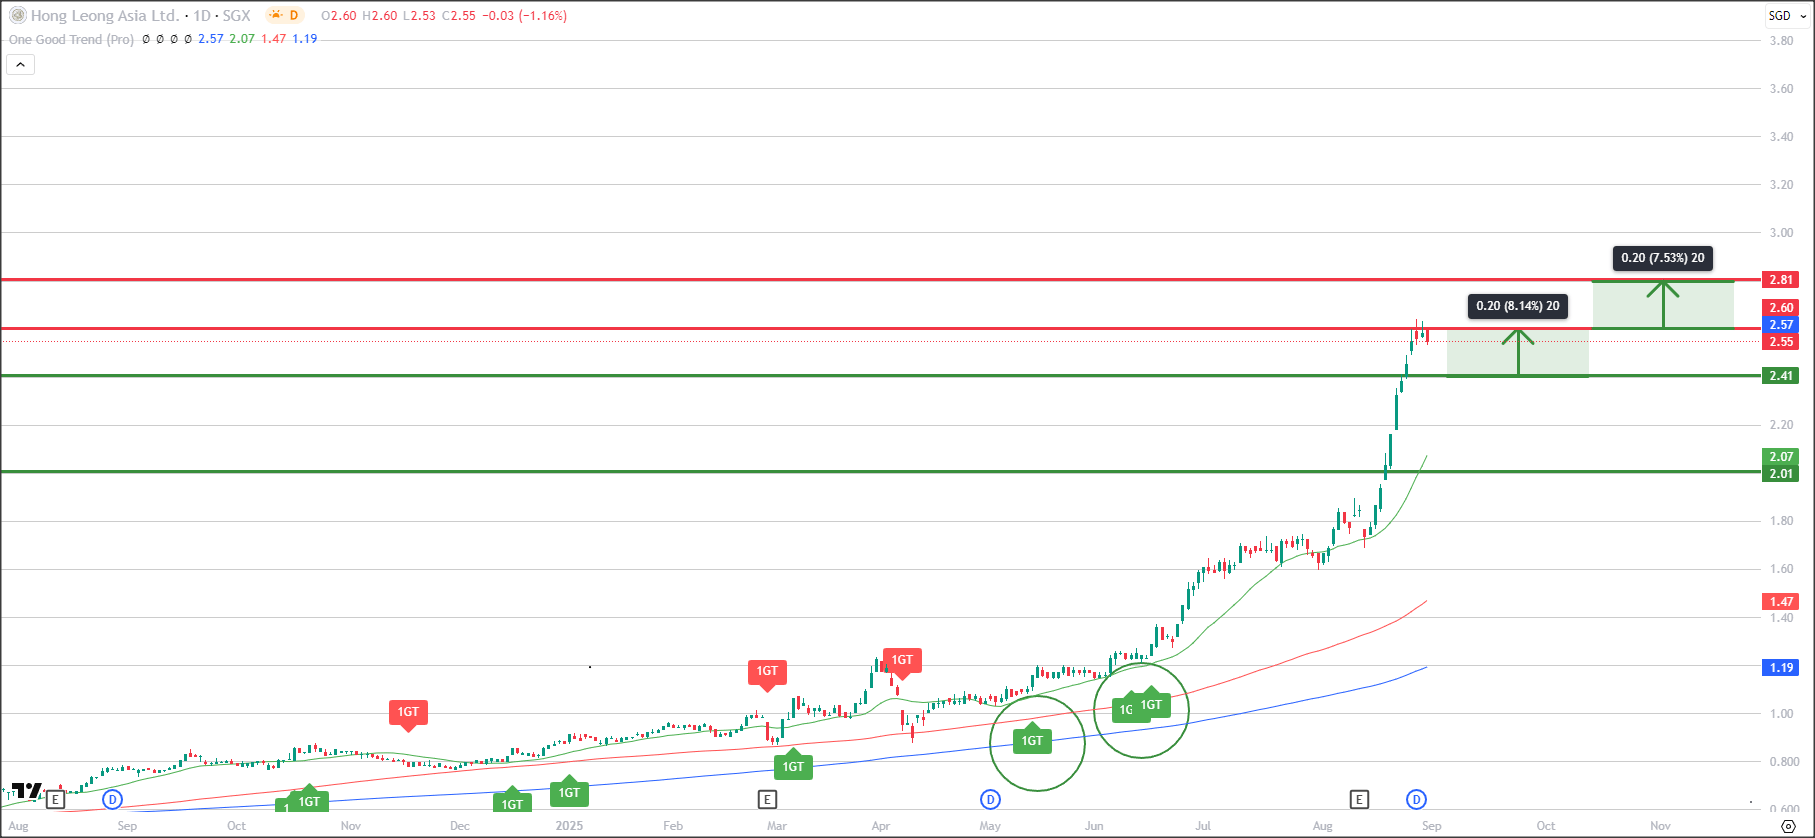
Hong Leong Asia (TradingView)
1GT Bullish Entry Signal Appeared on the 17 Jun 25, No Exit Signal Yet
About Hong Leong Asia
Hong Leong Asia is the trade and industry arm of the Hong Leong Group Singapore, a diversified multinational conglomerate.
Powertrain Solutions via China Yuchai International, it manufactures diesel, hybrid, and new-energy engines for vehicles and equipment in China.
Building Materials & Packaging supplies cement, ready-mix concrete, precast products, and rigid plastic packaging across Singapore and Malaysia.
Fundamental
For FY2024, Hong Leong Asia reported S$4.25 billion in revenue and S$87.8 million in net profit, supported by steady demand in China and the region.
The company maintains a solid equity base of over S$1 billion. Valuation looks moderate with a P/E ratio of ~14.9x and P/B of ~1.4x, while the stock offers a dividend yield of ~2.7%.
Return on equity is modest at ~2.9%, reflecting the capital-intensive nature of its businesses. Debt levels remain manageable, with total debt-to-equity around 83%.
Overall, Hong Leong Asia provides investors with a stable industrial play backed by both cyclical construction demand and long-term mobility shifts in China.
Technical
Price has been surging to new highs, after the 1.80 level was broken since mid August
All 3 moving averages are still heading up, suggesting that uptrend is still firmly intact
However, it seems like there is some resistance near the 2.60 - 2.65 level with selling pressure present
It would be good if price retract to find some stabilisation and potentially a new higher support, before breaking above the 2.60 for another leg up towards the 2.80 target
United States Stocks Spotlight
NVIDIA CORP (NVDA.NQ)
Target Price: US$200.00
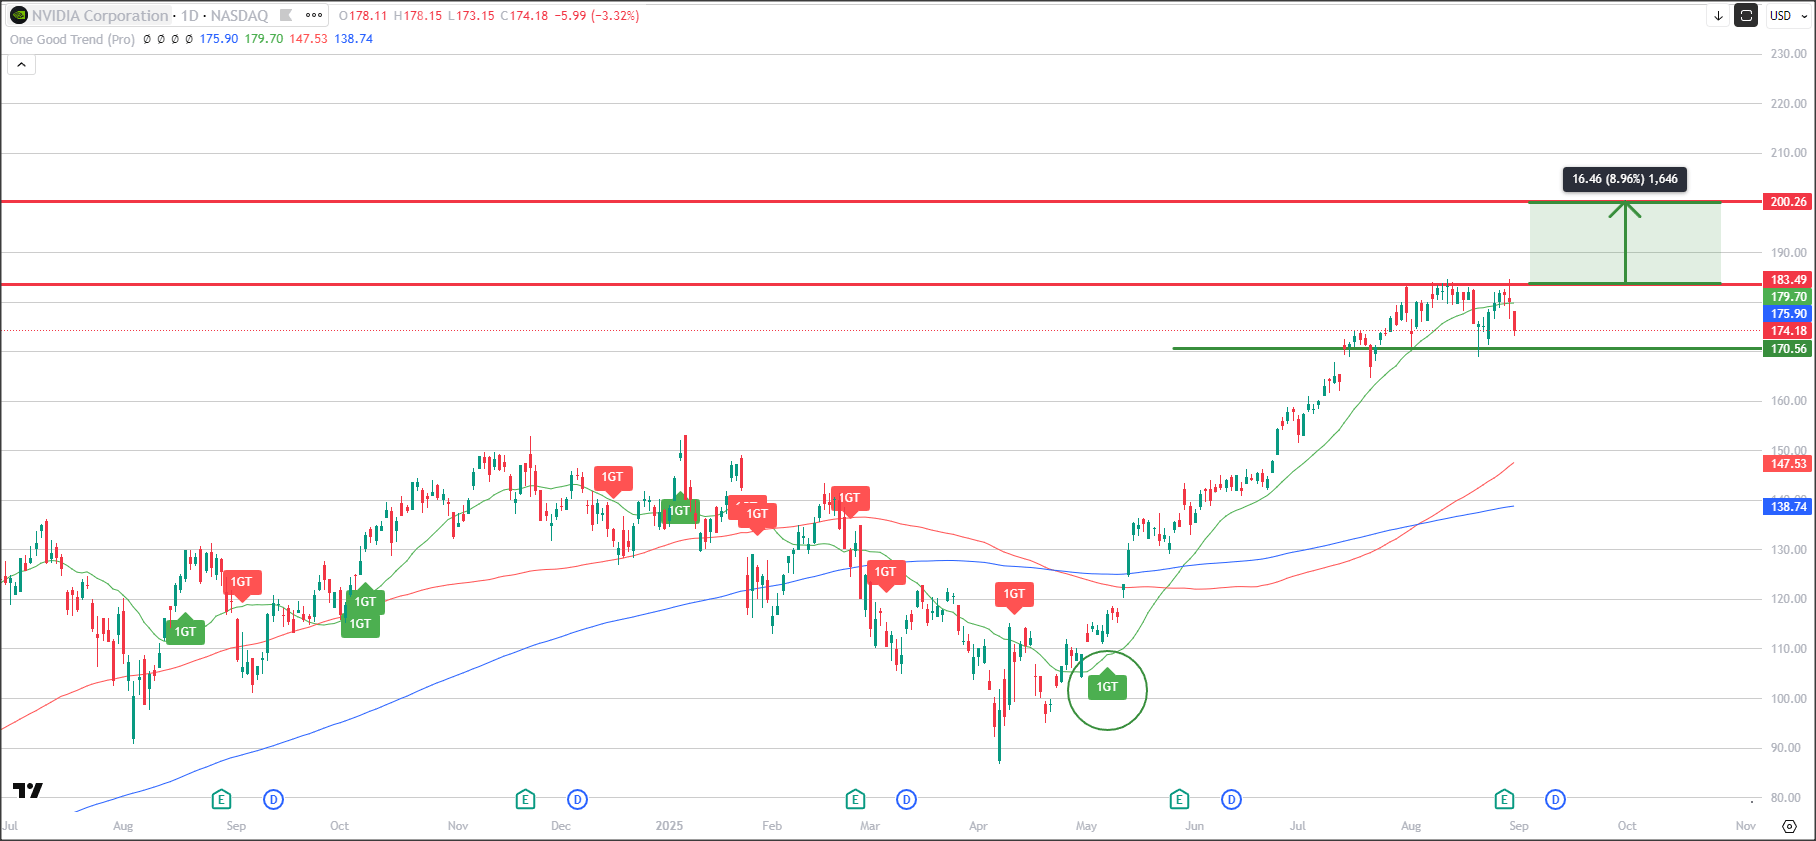
Nvidia Corp (TradingView)
1GT Bullish Entry Signal Appeared on 7 May 25, No Exit Signal Yet
About Nvidia
NVIDIA Corp. engages in the design and manufacture of computer graphics processors, chipsets, and related multimedia software
It operates through the following segments: Graphics Processing Unit (GPU) and Compute & Networking
Fundamental
In Q2 FY2026, Nvidia once again delivered record results with revenue climbing 56% year-on-year to US$46.7 billion.
Its data center business contributed US$41.1 billion, up 56% from a year ago, cementing its role as the backbone of AI infrastructure.
Net income surged 59%, while EPS of US$1.05–1.08 topped consensus estimates.
The company also unveiled a US$60 billion share buyback program, highlighting confidence in its long-term cash generation.
Looking ahead, management guided Q3 revenue to US$54 billion, slightly above expectations—even while excluding future sales to China due to chip export restrictions.
Technical
Price has been consolidating sideways between 170 - 185 since Aug
20d MA has also started to show signs of it flattening out, supporting the sideway movement
Longer-term trend remains intact as 100d and 200d MA are still heading up
If price can break and hold above 185 resistance, potential upside target towards 200 psychological resistance
Recent News (Click to Read)
NETFLIX INC (NFLX.NQ)
Target Price: US$1350.00
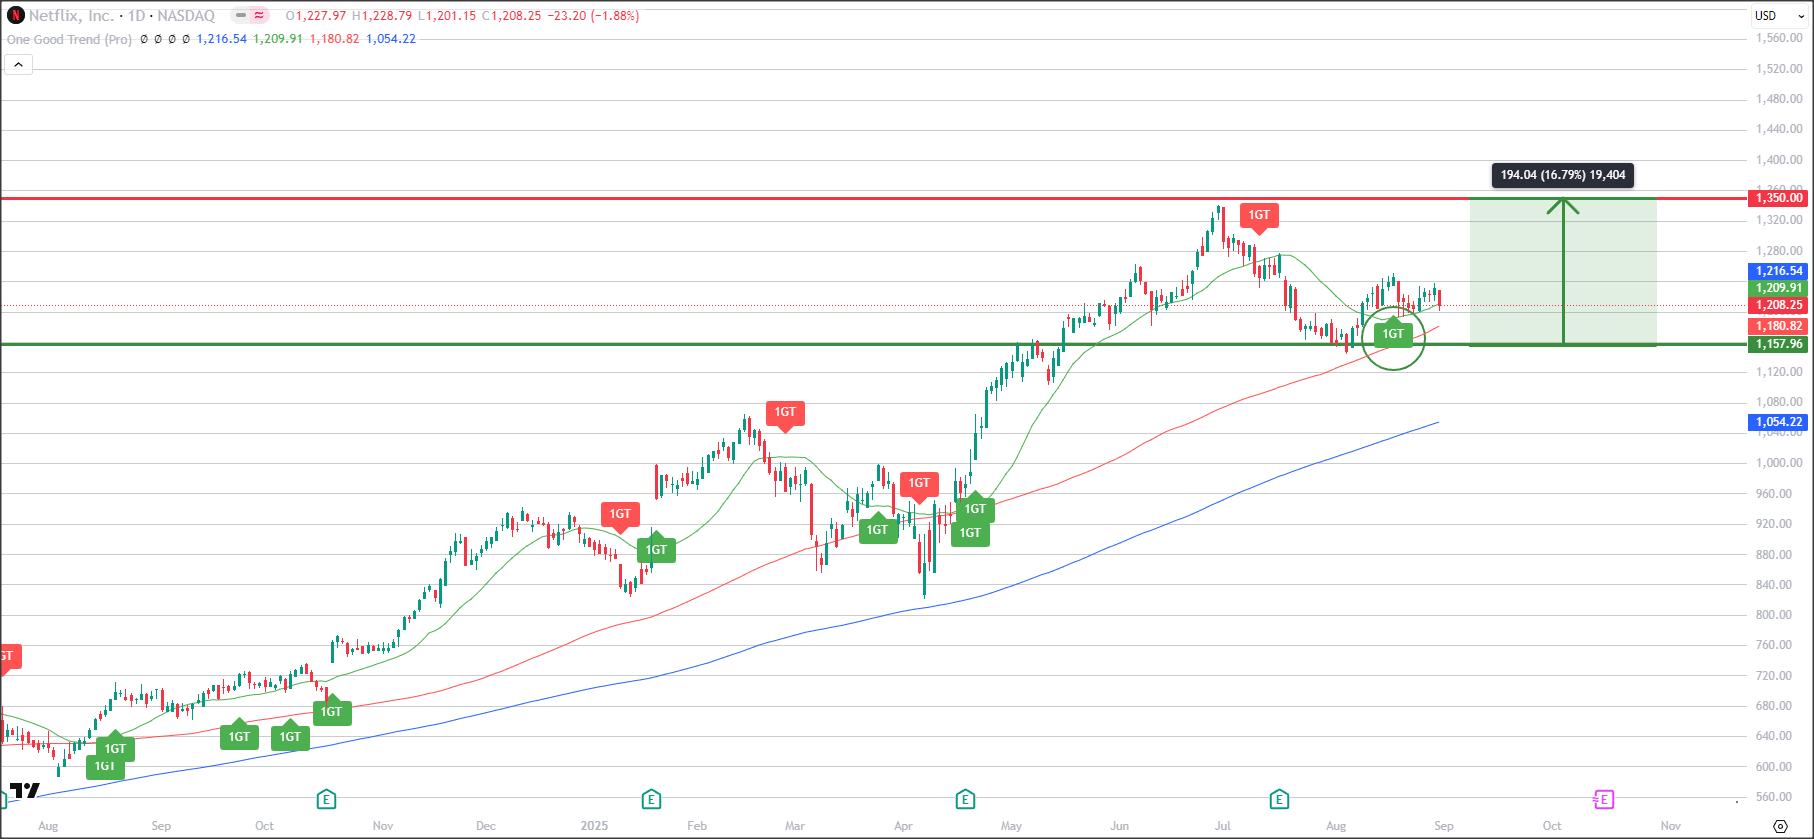
Netflix Inc (TradingView)
1GT Bullish Entry Signal Appeared on the 18 Aug 25, No Exit Signal Yet
About Netflix Inc
Netflix remains the world’s leading streaming platform, with a global subscriber base that continues to grow
The company has been expanding beyond films and series into live content, sports entertainment, and ad-supported tiers, broadening both its reach and monetization potential
Fundamental
In Q2 2025, Netflix reported revenue of US$11.08 billion, up 16% year-on-year, while net income surged 46% to US$3.1 billion (US$7.19 per share), well above market expectations
Management lifted its full-year guidance to US$44.8–45.2 billion and raised its operating margin target to ~30%, supported by stronger advertising revenue and FX tailwinds
Growth is being driven by its ad-supported tier, which is expected to double ad revenue in 2025, alongside blockbuster content like Squid Game 3 and live sports partnerships (WWE, NFL)
Netflix's free cash flow continues to expand, giving the company more flexibility to invest in content without relying heavily on debt. The balance sheet is healthier, with net debt levels manageable relative to cash flow
Technical
20d MA has recently started to point back up again, aligning with the longer-term trend (100d and 200d MA)
Key resistance appears to remain at 1350.00 as seen in July where selling pressure pushed price back down with a subsequent 1GT Bearish signal
As long as price continues to hold firmly above the trailing support, would not rule out more strength returning to this stock
Recent News (Click to Read)
META PLATFORMS INC (META.NY)
Target Price: US$800.00
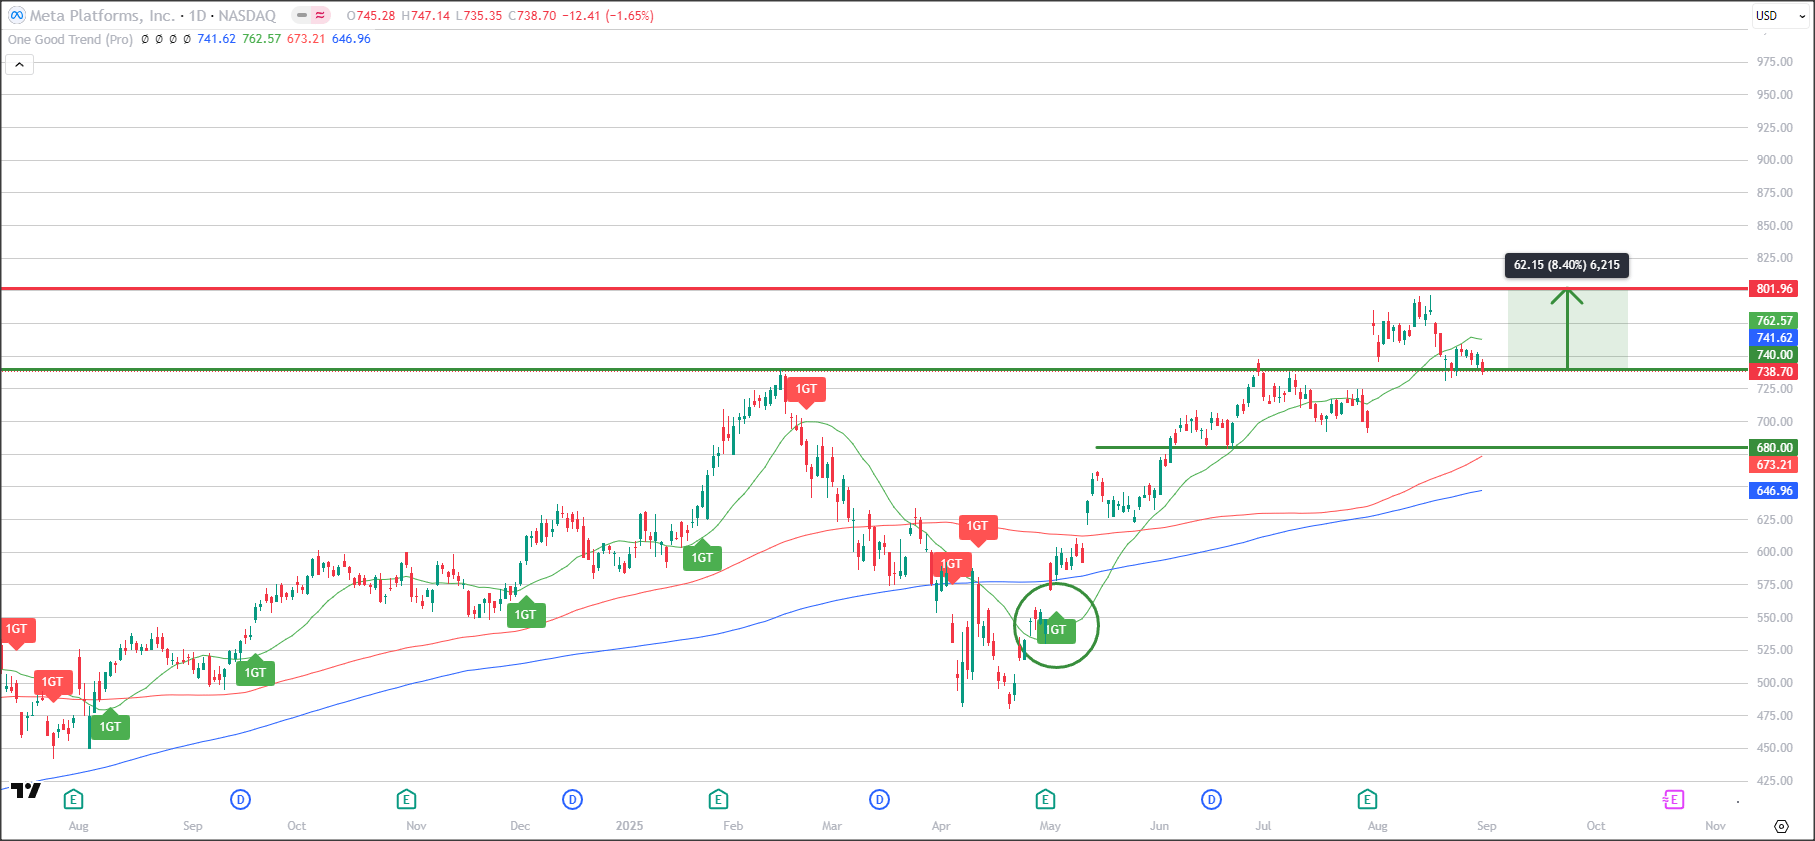
Meta Platforms Inc (TradingView)
1GT Bullish Entry Signal Appeared on 2 May 25, No Exit Signal Yet
About Meta Platforms Inc
Meta Platforms, formerly Facebook’s parent company, anchors one of the world’s largest social and advertising ecosystems, including Facebook, Instagram, WhatsApp, and Threads
It is rapidly advancing its AI infrastructure and ambitions, notably developing “personal superintelligence”, a strategy that extends far beyond advertising into global innovation and immersive experiences
Fundamental
Meta reported another strong quarter in Q2 2025 with revenue up 22% YoY to US$47.5 billion and net income climbing 36% to US$18.3 billion. Earnings per share came in at US$7.14, a 38% increase, driven by higher ad pricing (+9% YoY) and improved cost discipline
Operating margin rose to 43%, underscoring the company’s efficiency gains
Daily active users across Meta’s platforms reached 3.48 billion, up 6% from a year ago. The ad-supported business continues to power growth, supported by AI-driven targeting improvements.
Meta also showcased strong financial flexibility, generating US$8.6 billion in free cash flow, holding US$47 billion in cash, and returning US$9.8 billion to shareholders through buybacks
Capital expenditure is expected to hit US$66–72 billion this year, largely to fund AI data centers and infrastructure
Technical
Price looks to be currently testing the 740.00 support level
Longer-term trend remains intact with 100d and 200d MA still heading up, but is currently experiencing some short-term weakness as 20d MA has started to point down
As long as price is still holding above the trailing support and 20d MA starts to flatten out to suggest halting of short-term weakness, would not rule out more upside back towards 800.00
Recent News (Click to Read)
Note that by subscribing to receive any of Joey's training by email, you agree to allow us to send you the training by email. Investments are subject to investment risks including the possible loss of the principal amount invested. The value of the units in any fund and the income from them may fall as well as rise. If the investment is denominated in a foreign currency, factors including but not limited to changes in exchange rates may have an adverse effect on the value, price or income of an investment. Past performance figures as well as any projection or forecast used in these web pages, are not necessarily indicative of future or likely performance of any investment products. By Accessing this Website and ANY of its pages, you are agreeing to the terms set out ON ALL the following pages as seen below. Copyright © | Joey Choy | All Rights Reserved | Disclaimer | Privacy & Security Policy | Terms and Conditions
